Mutual Fund/ETF Replicator
Mutual Fund/ETF Replicator
Find a single or compound ETF (Exchange Traded Fund) that has similar performance attributes to a Mutual Fund or ETF you're thinking about investing in, but with fewer fees and at a lower overall cost.
Enter a Mutual Fund or ETF along with an investment amount, and the Mutual Fund/ETF Replicator scans the market to find ETFs whose performance most closely parallels that of the fund or ETF you entered, and calculates the number of shares to buy to achieve that performance. Review comprehensive performance analysis and see the fee difference and percent of correlation between the original and all replicated contracts.
Using the Tool
Open the Mutual Fund/ETF Replicator
- In Mosaic: Select the New Window button in the top left corner and search for Mutual Fund/ETF Replicator.
Alternatively, you may select New Window > Select More Advanced Tools > Select Mutual Fund/ETF Replicator. - In Classic TWS: Select the Analytical Tools button at the top of the page > Select Mutual Fund/ETF Replicator under the Technical section.
In the Mutual Fund/ETF Entry panel, first enter a fund or ETF in the Entry field, or use the Browse Mutual Funds link to find a fund family and a fund. If you would like the tool to return comparable ETFs with the highest liquidity, also check Consider Liquidity During Search.
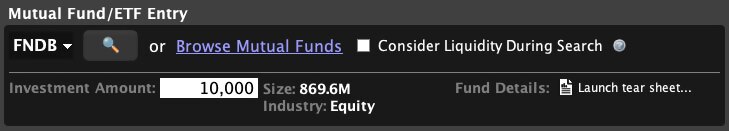
The Investment Amount is used to calculate the number of shares of the returned contract required to create a comparable investment to the original entry. For example, an investment amount of 10,000 (the default amount) might purchase 573 shares of the original contract, but only 205 shares of the comparable ETF. If you know the amount you want to invest, enter it for a more precise result.
Understanding the Return Results
View the ETF Display
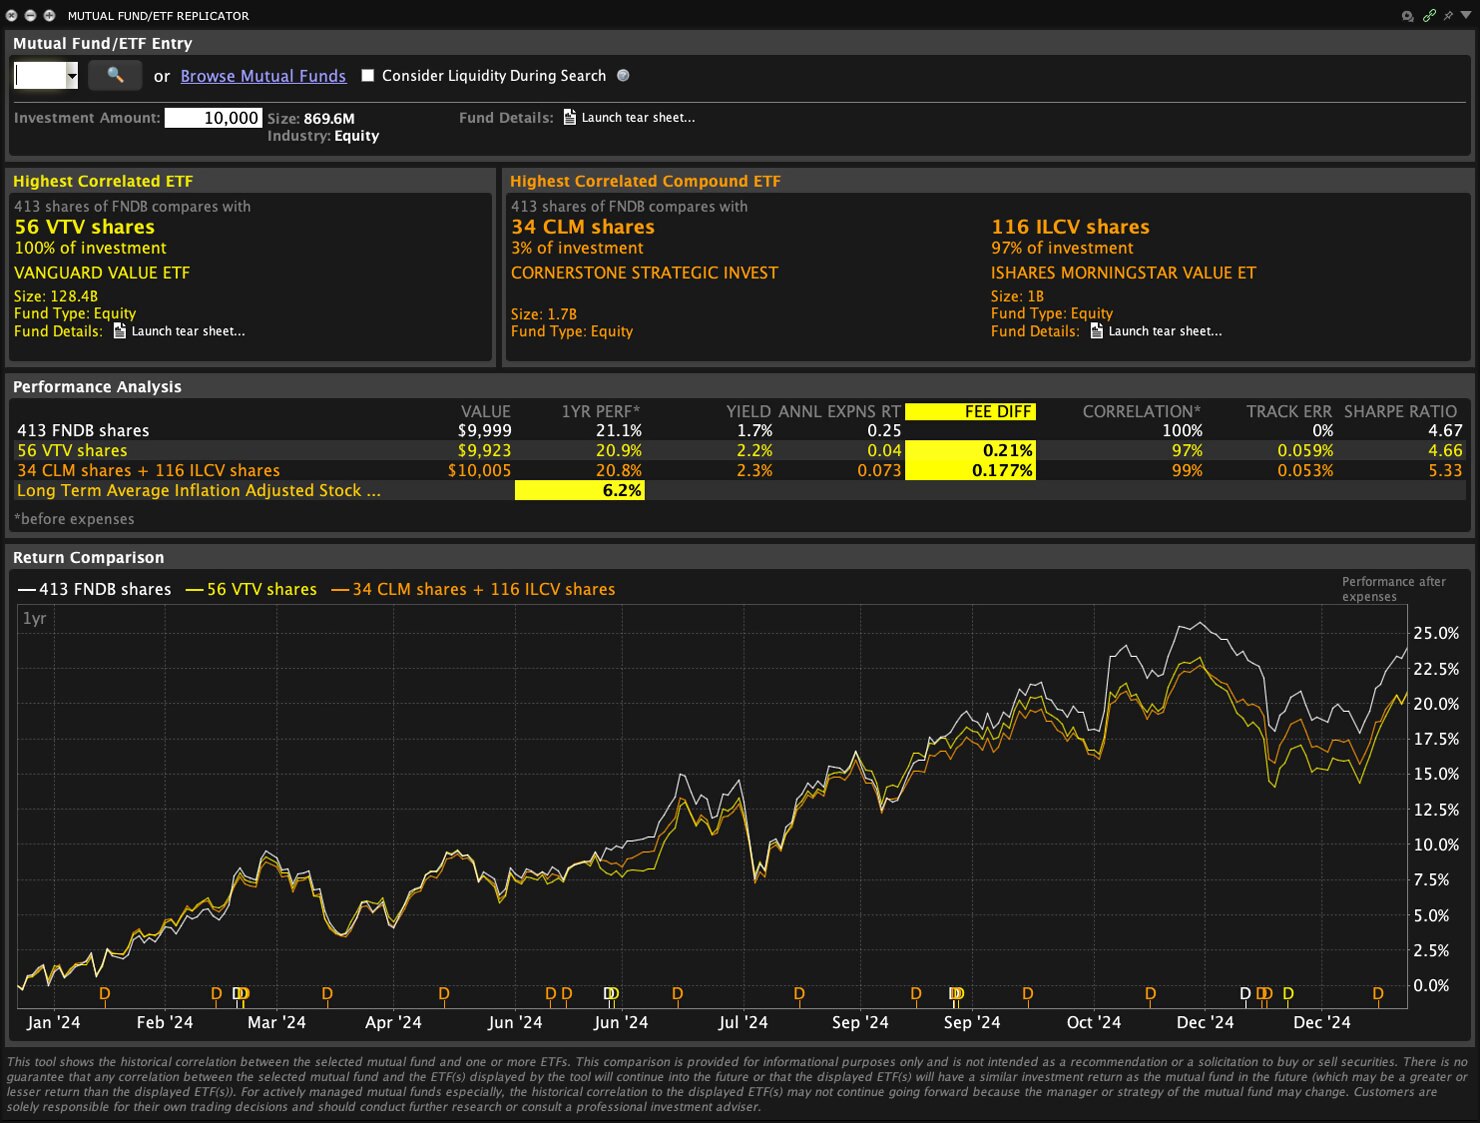
The highest correlated ETF and compound ETF will display on the two panels below the entry field.
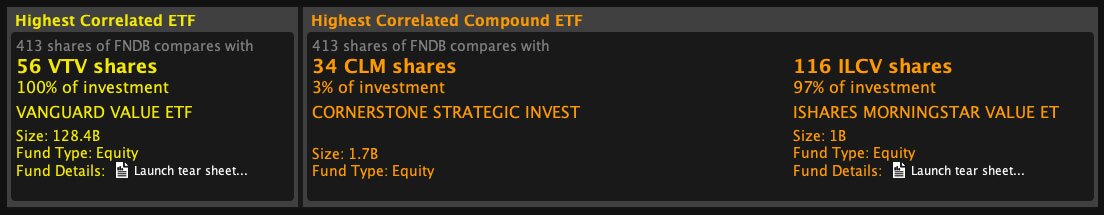
When viewing the ETF, find the following data points:
- ETF symbol
- Share Count — Based on the investment amount, this is the number of shares of the Mutual Fund that will be converted to the ETF.
- Investment percentage — A single ETF will display a 100% distribution while the compound ETF panel will show you how the investment amount is allocated to each ETF.
- Full fund name (e.g., ISHARES RUSSEL TOP 200 GROW)
- Fund Size
- Fund Type (e.g., equity)
Review the Performance Profiles
Below the ETF panels, view the Performance Analysis table where you can find information about the historical comparison of the Mutual Fund and the ETF returned to you. The focus of the data highlights the exact percentage you can save in management fees.
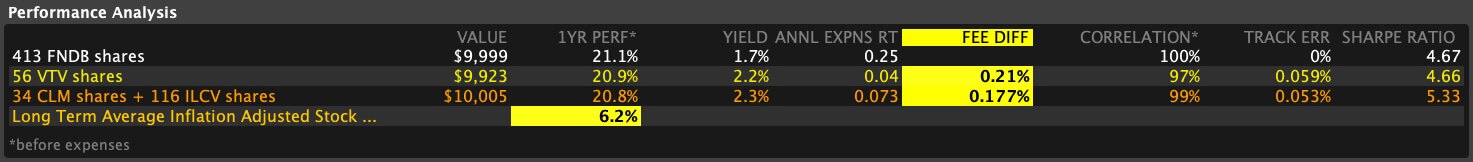
The following fields are displayed:
- VALUE — The value of 100 shares of the Mutual Fund and the comparable quantity of the ETF.
- 1YR PERF — The one year performance of both the Mutual Fund and the comparable quantity of the ETF.
- YIELD — The one year dividend yield of both the Mutual Fund and the comparable quantity of the ETF.
- ANNUAL EXPENSE RATIO — The estimated annual expenses for both the Mutual Fund and the ETF.
- FEE DIFF — The estimated management fee difference between the Mutual Fund and the ETF.
- CORRELATION — How closely the daily return of the comparable ETF correlates to the Mutual Fund.
- TRACK ERR — Tracking error is computed by comparing the daily return of the Mutual Fund and ETF over the period of the last year.
- SHARPE RATIO — Measure of excess return (risk premium) per unit of deviation.
Note: The one year performance and correlation values are calculated before expenses.
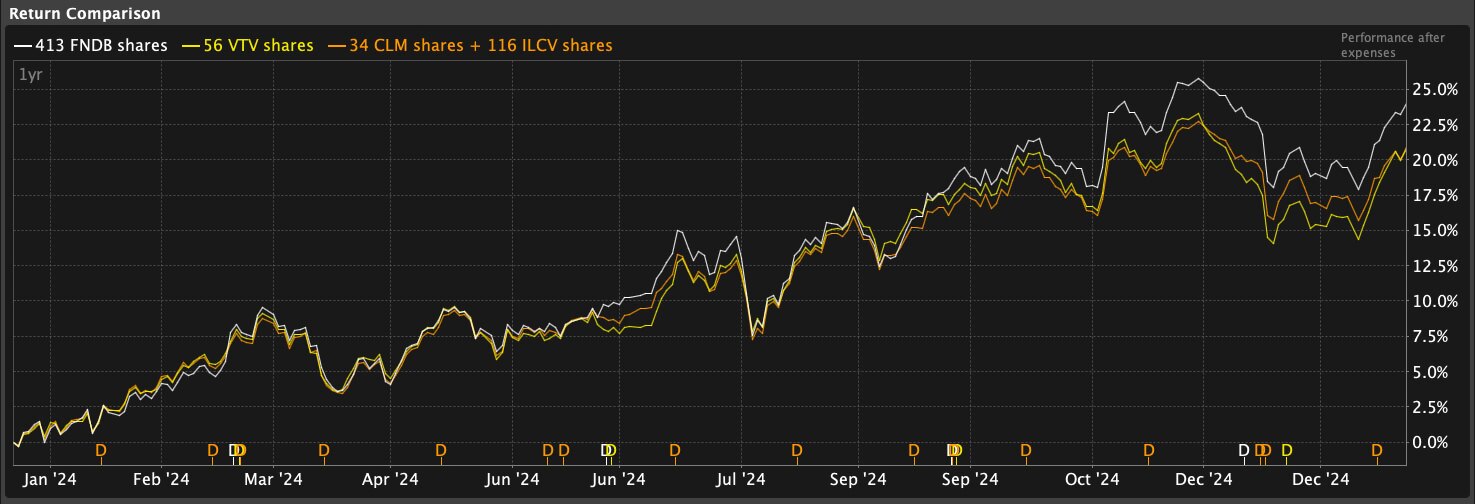
Compare the Rate of Return
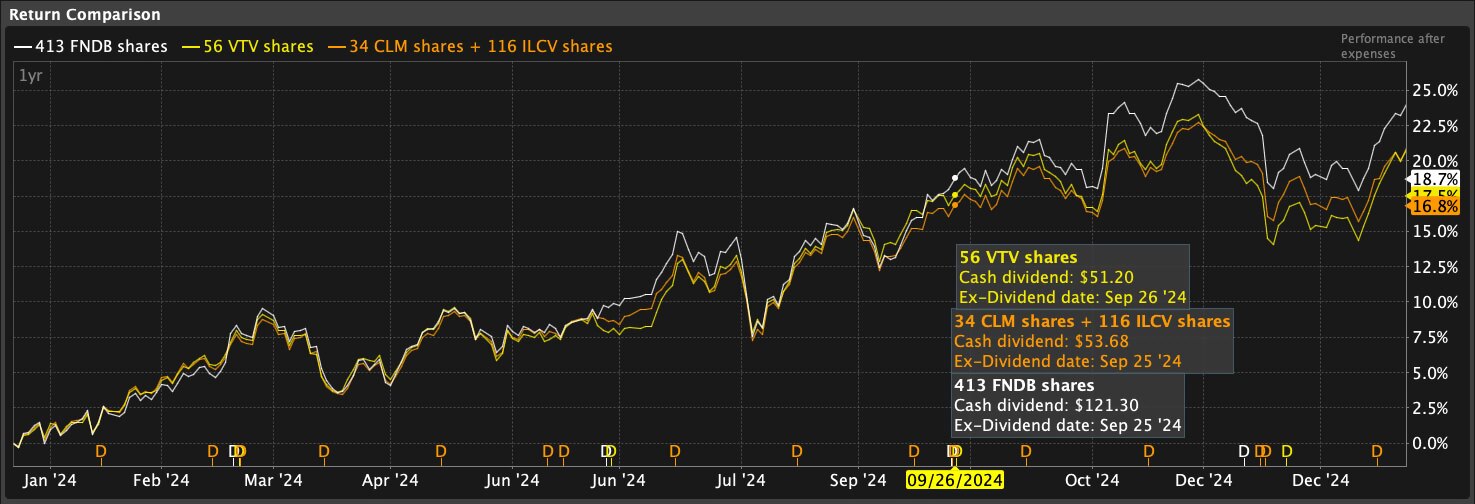
The bottom panel charts the Mutual Fund against the ETF to graphically display the rate of return after expenses over a one-year period. As you browse and mouseover each fund, you can view the rate percentage broken down to a daily basis.
Tooltips will display a side-by-side comparison of each fund. Mouse over the "D" symbol along the graph to view Cash Dividends and the Ex-Dividend date.
USER GUIDES
Get Started with the Mutual Fund/ETF Replicator
For more information on the Mutual Fund/ETF Replicator, select your trading platform.
Disclosures
- The projections or other information generated by the Mutual Fund /ETF Replicator regarding the likelihood of various investment outcomes are hypothetical in nature, do not reflect actual investment results and are not guarantees of future results. Please note that results may vary with use of the tool over time.