Interactive Flash-based charts let you view market value and volume for a single stock, future or index for one of seven time periods (1 or 5 days, 1, 3 or 6 months, 1 or 5 years). You can select one of three chart types (line, OHLC and candlestick) and zoom into the data to view a portion of the time period using an interactive slider built into the chart. You can add an interactive chart to any page in WebTrader using the Preferences window
except Search .
Interactive charts let you do any the following:
You must have Adobe Flash Version 9.0 or higher to view interactive charts.
To add a chart to a page
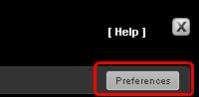
From any page in WebTrader, click the Preferences button.
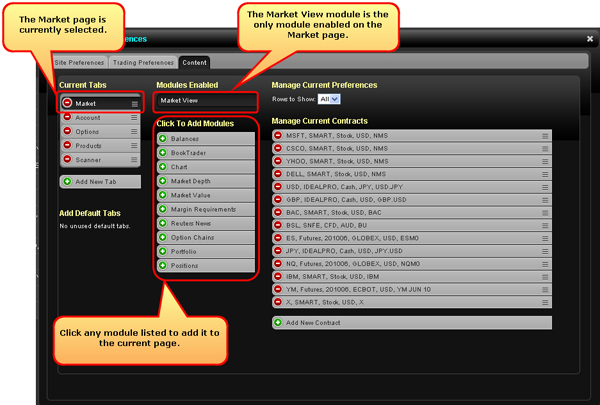
The Preferences window opens to the Content tab. In the figure below, the Market page is the currently selected tab and the Modules Enabled list shows that only the Market View module is enabled on that page.
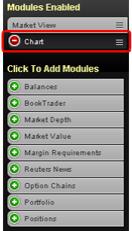
In the Click the Add Modules section, click Chart. The Chart module is added to the Modules Enabled list.
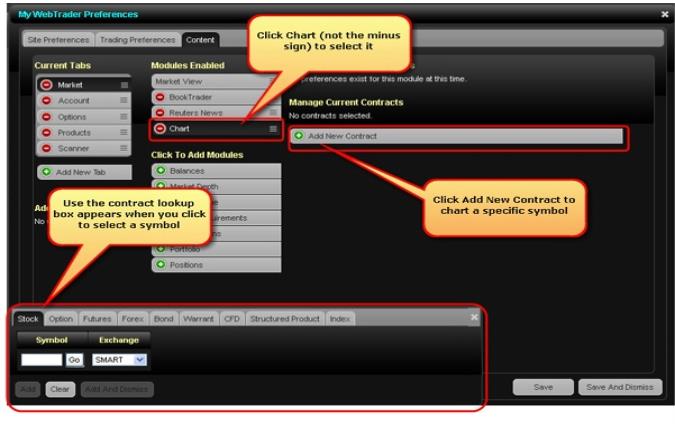
You add a symbol to the Chart module in the Preferences window. Click Chart in the Modules Enabled list to highlight it, then click Add New Contract.
To remove symbols from the module, click the minus sign on the instrument in the Manage Current Contracts list.
Click Save and Dismiss in the lower right corner of the window to save your changes and close the Preferences window.
The Chart module displays on the page.
To change the instruments in Reuters News once it is displayed on the page, click Edit, then use the contract/security lookup box.
The Chart module appears on the page.
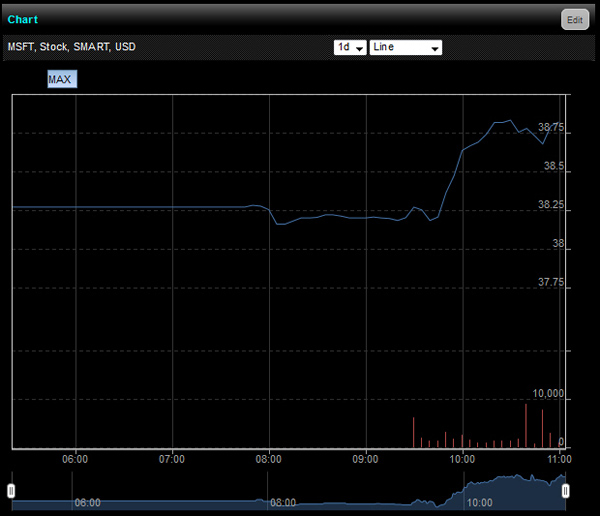
In the Chart module, select a time period and chart type from the drop-down lists. The default time period is 1d and the default chart type is Line. The interactive chart displays.
An interactive chart includes the following information:
Two charts that use the same Time period:
Market Value over Time Volume over Time
Zoom buttons let you change the time period.
The date and time, price and volume for the data point are displayed when you move your mouse cursor over the chart.
The scroller at the bottom of the chart highlights the data displayed in the line charts and lets you manually change the time scale.
You can modify the chart by entering a different symbol or by changing the instrument type, time period and chart type.